This is an excellent question that we often hear from first-time customers. In this blog post, we break down where the ratings come from and how to interpret them for your pavement management needs.
From images to pavement ratings
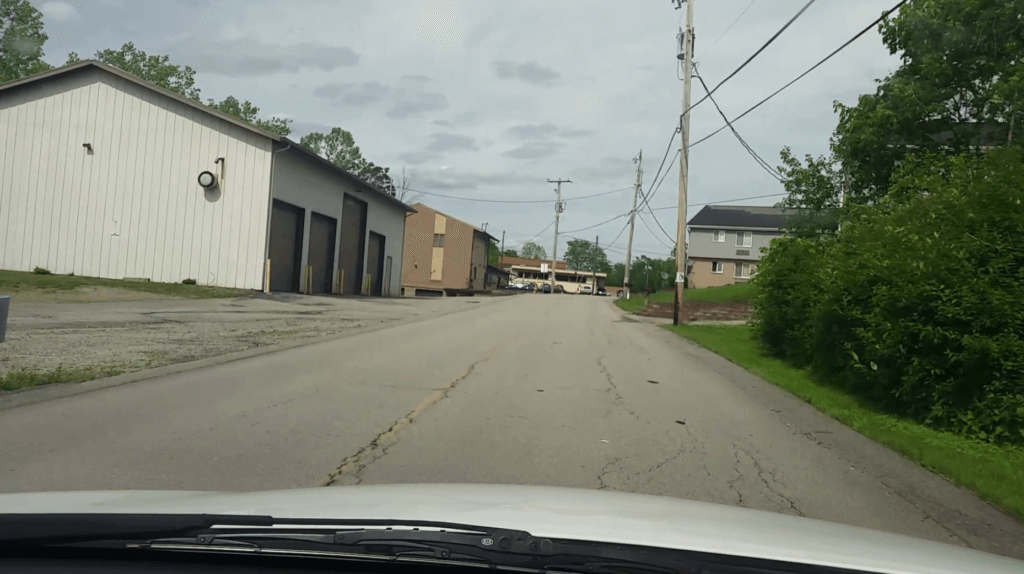
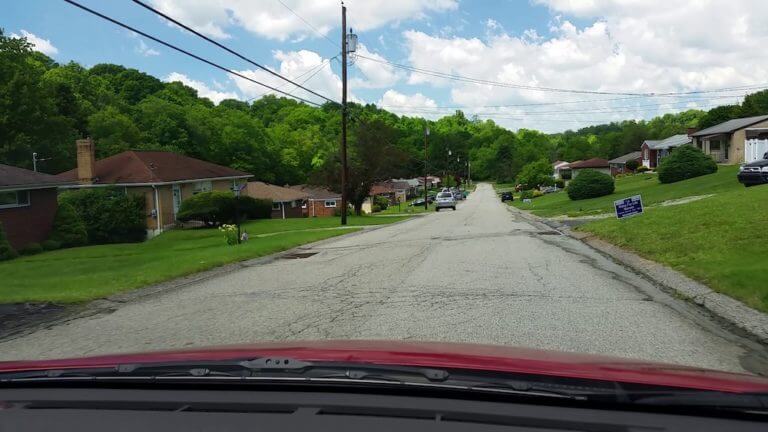
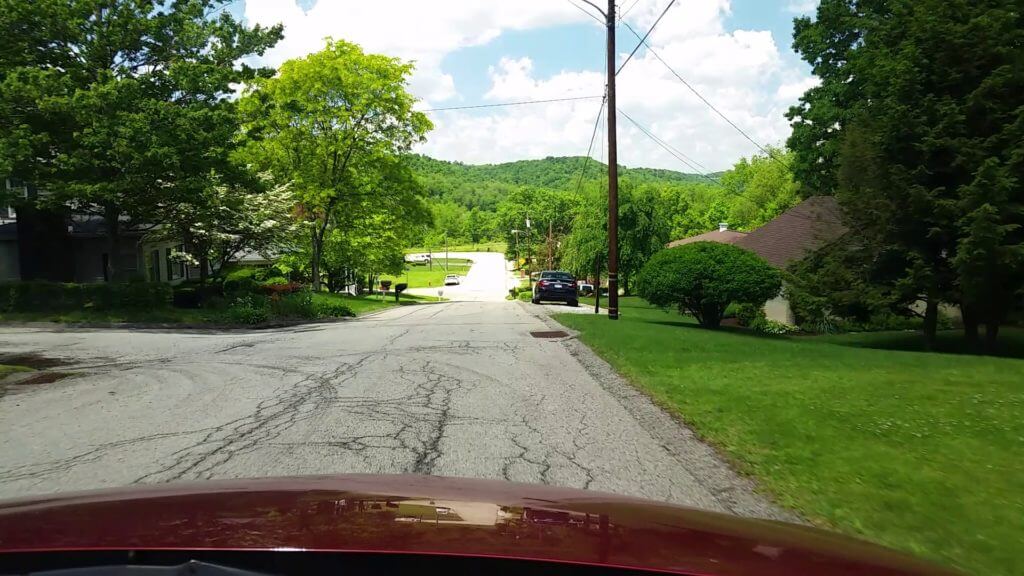
RoadBotics ratings start with high-resolution images of our customers’ entire road networks. Our teams of operations technicians collect these images by driving the full extent of a customer’s roadways using standard passenger vehicles equipped with windshield-mounted smartphones. The smartphones capture images of the pavement surface via our proprietary RoadSense data collection app.
We take these images from the field and extract high quality images for every 3-meters (10-feet) along all the roadways in a customer’s network. These images are then transferred to our machine learning process where they are assessed pixel-by-pixel and automatically assigned a 1-5 condition rating score. Each rated image, called a “Point” is then GPS snapped to the interactive RoadWay platform map. In this way, customers can login to RoadWay and view the rated images of their entire road network.
So what do the RoadBotics Rating mean?
Here are the basics to know about the RoadBotics ratings:
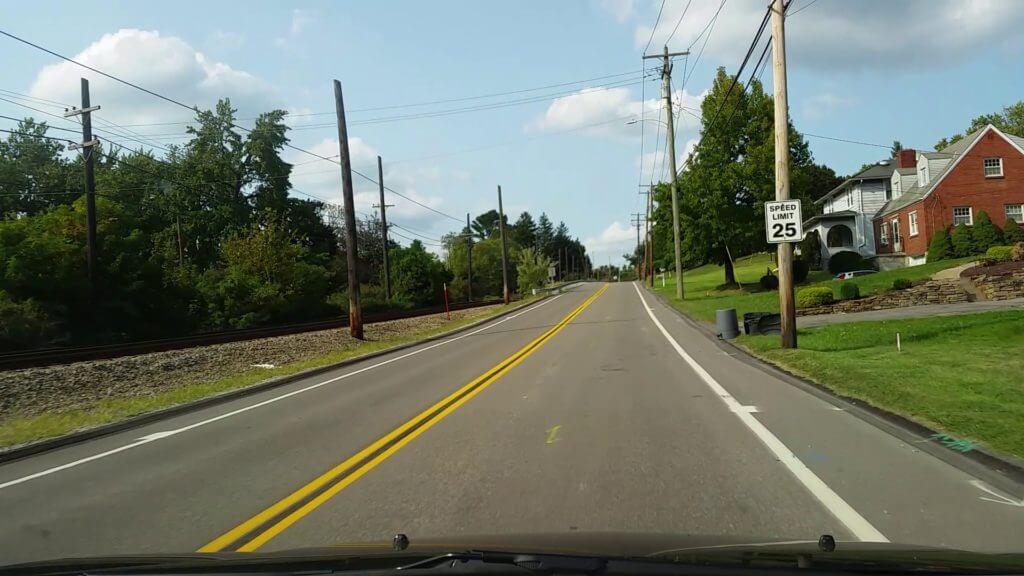
Level 1: No or very minor surface damage. This is likely a road that was paved within the past 3 years.
Level 2: Minor surface damage, no critical issues. This road is beginning to show typical wear and tear.
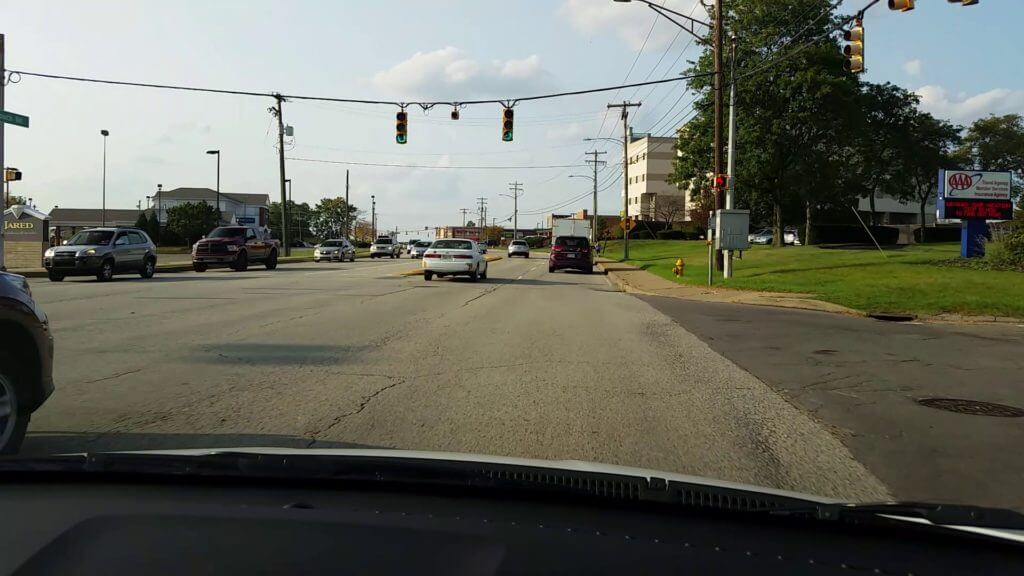
Level 3: Appearance of pervasive surface distresses. Important issues on the surface are beginning to show.
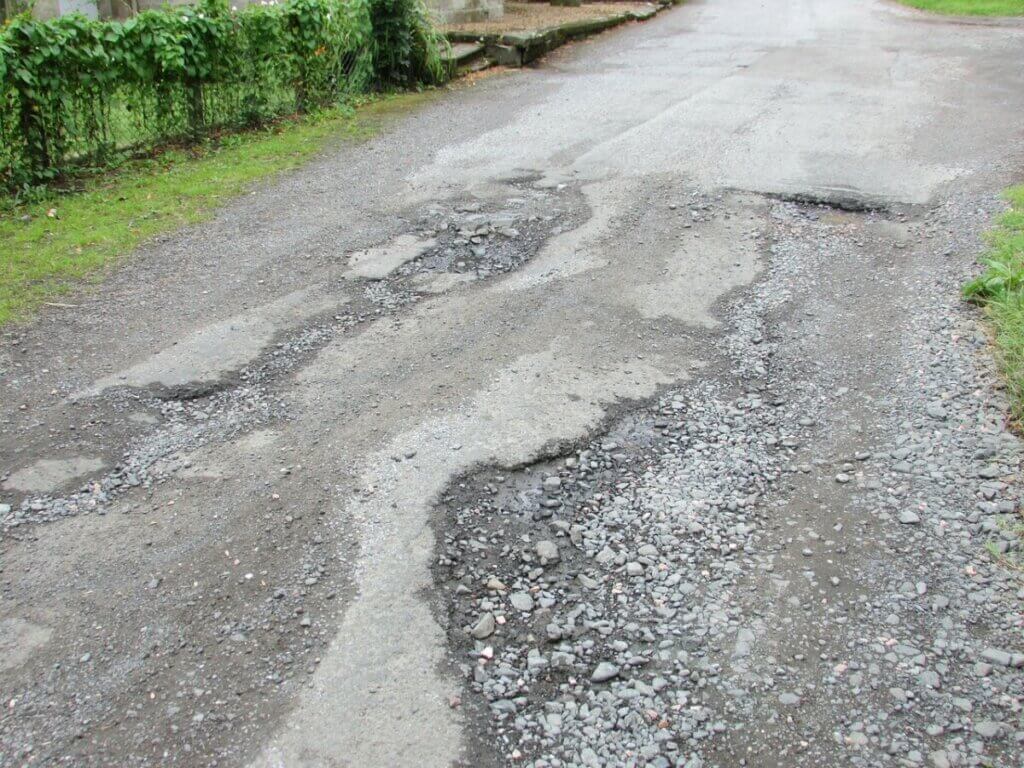
Level 4: Significant damage or emerging critical failures. The road damage is beginning to exacerbate.
Level 5: Major surface damage and/or critical surface failures are present on the road surface.
RoadBotics machine learning process automatically generates these 1-5 ratings for each image data point it analyzes based on these characteristics:
- Type of distresses present
- Frequency of appearance of distresses
- Density of distress composition in the image
The numeric ratings are often described as integers (1, 2, 3, 4 or 5), but the actual distribution of their value is defined to the tenth decimal. The highest bound of the rating system is 1.00 and the lowest bound is 5.00.
Level 1 “Green” = 1.00 to 1.49
Level 2 “Light Green” = 1.5 to 2.49
Level 3 “Yellow” = 2.5 to 3.49
Level 4 “Orange” = 3.5 to 4.49
Level 5 “Red” = 4.5 to 5.00
This rating system is based on PASER – the standard method and 1-10 scoring model used by trained civil engineers for visually inspecting the condition of road surfaces. PASER ratings are generated by a civil engineering walking or driving along a roadway, viewing the pavement surface and making 1-10 judgement about the condition of the road surface based on a standardized, pre-defined criteria. Unlike PASER, where the rating reflects the quality / condition of the road (1 is a poor road), the RoadBotics scale reflects the level of distress (1 is a high quality, newer road surface).
Reading Points vs. Segment data
Point Data – Remember that point data represents images that were collected and initially rated 1-5 via RoadBotics’ machine learning process. Points represent approximately a 3-meter (10-foot) path of roadway. Points are snapped to their location on the RoadWay mapping platform based on their GPS coordinates. When you click on a point in RoadWay, you see the image that was captured, the color-coded and numeric rating generated for that image, a timestamp of when the image was taken and the GPS latitude/longitude.
Segment Data – Point data is valuable because it enables pavement managers to zoom into the see the distresses on a 3-meter area of pavement with scalpel-like precision. However, pavement planning typically requires a more macro understanding of road segment conditions. As such, customer use RoadBotics segment data to view the average rating of all the points along a road segment on an intersection-to-intersection basis. RoadBotics visualizes the composition of the point ratings that make up the average score through a histogram the is viewable after a customer clicks on the segment. To see the percentage of rated points that exist on a particular segment, just hover each section of the histogram.
The Big Goal: Useful Data
The big goal behind RoadBotics’ 1-5 rating system is to provide customers the data that is most pertinent to their pavement management planning and decision making needs.
More specifically, here are the three driving principles behind our ratings philosophy:
Decision Making Data – Other methods of rating a road network often include tons of extraneous data that is interesting, but not critical to the immediate decision making needs of pavement managers. RoadBotics provides tactical data about the surface condition of the roadway that meets the decision-making threshold for both maintenance and strategic planning purposes.
Cross Purpose Data – RoadBotics maximizes the pavement rating data by connecting it with critical contextual data points including GPS coordinates, timestamps, images, street names, and road lengths. Moreover, the interactive RoadWay mapping platform is designed for engineers and non-engineers alike, which enables a variety of government stakeholders outside of pavement (e.g. attorneys, 311 staff, city planners) to gain valuable use from the data provided by RoadBotics.
You Make the Decisions – Rather than prescribing specific maintenance and planning actions, RoadBotics rating system and corresponding data is intended to inform customers of their road network’s condition at the macro and micro levels of analysis. We provide all the critical contextual information and our customers make the important data-driven maintenance and planning decisions.