
2021 has been a challenging year full of changes!
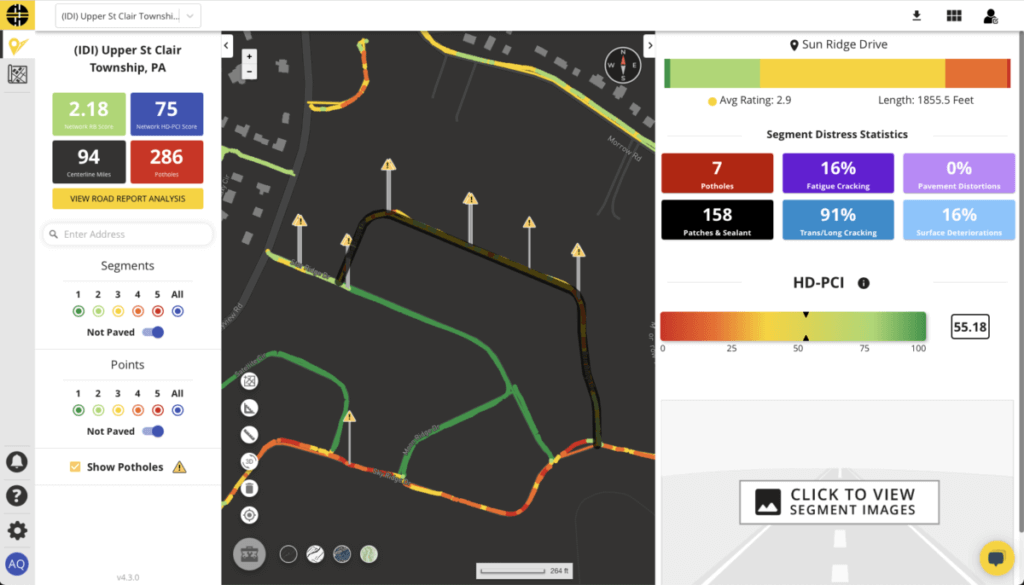
Working through a pandemic has made us realize how valuable technology can be in overcoming obstacles. It inspired us to release our interactive asset mapping platform, AgileMapper, last May.
After carefully mapping our way through the rest of the year – and helping our clients put their visual data to work for them using AgileMapper – we’re ready to put 2021 to rest.
Before counting down to 2022, let’s take a look back at the top 5 blog posts are readers found the most engaging this year.
We stared tracking the Infrastructure Bill from its inception in August 2021 to provide a high-level overview of what has happened and what you can expect next.
This bill finally became a law on November 15, 2021 – so it’s no surprise this was one of your favorites.
Look back at our monthly updates:
…and keep following along as we track how these funds are being put to use!
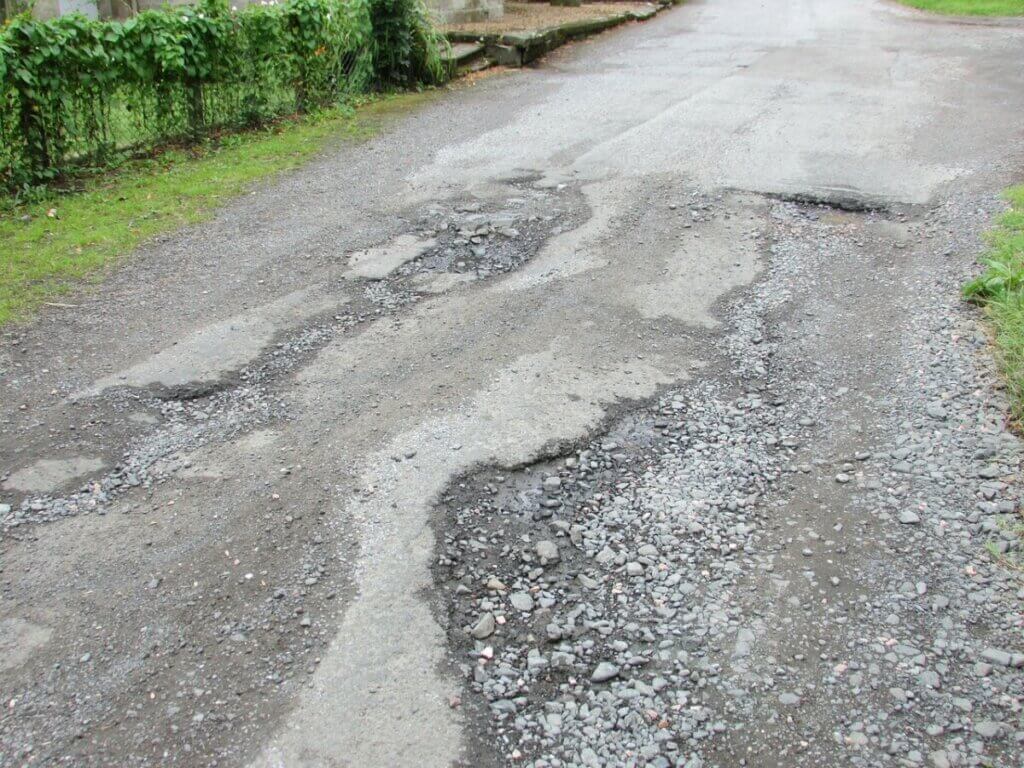
The one thing everyone can agree on: Potholes are the WORST.
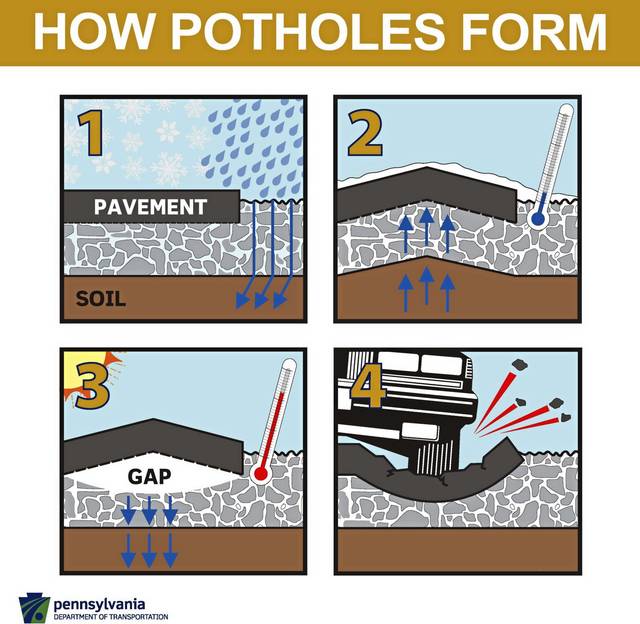
Since you have to know ’em to beat ’em, we pulled back the curtain on how potholes form and why they are so troublesome.
They are pervasive across climates, but tend to be more severe in regions that experience a freeze/thaw cycle.
This is due to the fact that when water enters existing cracks in road surfaces and then freeze, it expands!
You can keep learning about the distress you love to hate here.
We entered 2021 with a new President and ambitious goals, which meant many new members of the Presidential Administration were introduced! This included former South Bend Mayor and RoadBotics customer, Secretary Pete Buttigieg.
Secretary Pete showcased his ability to innovate and adapt during his time in office at South Bend.
Now, he oversees the US DOT and will have his work cut out for him as applications for the competitive grants included in the Infrastructure Bill start rolling in.
After releasing our US City Roads Report, we made the associated open data set available at no cost to anyone who was interested.
RoadBotics was originally spun out of Carnegie Mellon in 2017 and still partners with the university’s research. Therefore, we thought it only fitting to give back to our academic roots!
The data includes videos, GPS data, and accelerometer data that was collected during the assessments for the 20 cities. It also provides the point-level and segment-level data corresponding to the coverage we selected out of the raw data for the U.S. City Roads Report.
If you’d like to access the data, just fill out the form on the bottom of this page!
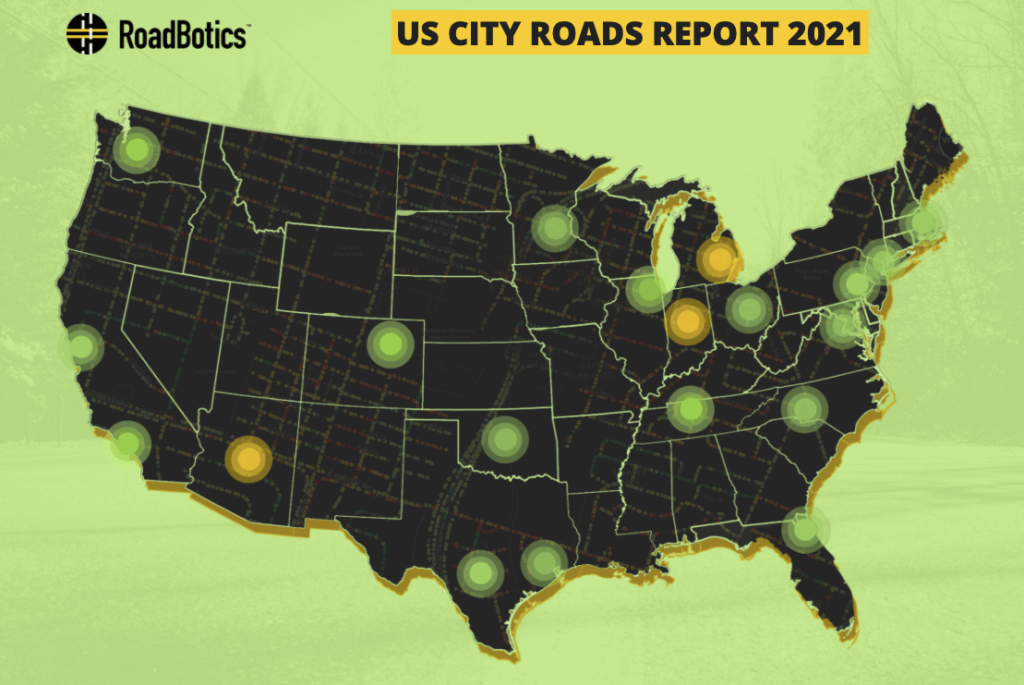
Our US City Roads Report was released in March and provided a look at 20 US city road networks and their conditions.
The release coincided with ASCE’s Infrastructure Report Card that rated our nation’s infrastructure a “D”. Fortunately, many of the 20 cities we assessed fared slightly better.
If you didn’t get the chance to click around, visit the interactive map to see how the cities stacked up to the national average!
We hope you’ve enjoyed our look back and are ready for what next year will bring.
Stay tuned and keep in touch – we have much more in store for 2022.

© 2023 RoadBotics, Inc | 322 North Shore Drive, Suite 200, Pittsburgh, PA 15212
| Cookie | Duration | Description |
|---|---|---|
| __hssrc | session | This cookie is set by Hubspot whenever it changes the session cookie. The __hssrc cookie set to 1 indicates that the user has restarted the browser, and if the cookie does not exist, it is assumed to be a new session. |
| _GRECAPTCHA | 5 months 27 days | This cookie is set by the Google recaptcha service to identify bots to protect the website against malicious spam attacks. |
| ak_bmsc | 2 hours | This cookie is used by Akamai to optimize site security by distinguishing between humans and bots |
| citrix_ns_id | session | This cookie is set by the provider Citrix, a web application firewall. This cookie is used for protecting the website against known and unknown attacks. |
| cookielawinfo-checkbox-advertisement | 1 year | Set by the GDPR Cookie Consent plugin, this cookie is used to record the user consent for the cookies in the "Advertisement" category . |
| cookielawinfo-checkbox-analytics | 1 year | Set by the GDPR Cookie Consent plugin, this cookie is used to record the user consent for the cookies in the "Analytics" category . |
| cookielawinfo-checkbox-functional | 1 year | The cookie is set by the GDPR Cookie Consent plugin to record the user consent for the cookies in the category "Functional". |
| cookielawinfo-checkbox-necessary | 1 year | Set by the GDPR Cookie Consent plugin, this cookie is used to record the user consent for the cookies in the "Necessary" category . |
| cookielawinfo-checkbox-others | 1 year | Set by the GDPR Cookie Consent plugin, this cookie is used to store the user consent for cookies in the category "Others". |
| cookielawinfo-checkbox-performance | 1 year | Set by the GDPR Cookie Consent plugin, this cookie is used to store the user consent for cookies in the category "Performance". |
| CookieLawInfoConsent | 1 year | Records the default button state of the corresponding category & the status of CCPA. It works only in coordination with the primary cookie. |
| elementor | never | This cookie is used by the website's WordPress theme. It allows the website owner to implement or change the website's content in real-time. |
| JSESSIONID | session | The JSESSIONID cookie is used by New Relic to store a session identifier so that New Relic can monitor session counts for an application. |
| viewed_cookie_policy | 1 year | The cookie is set by the GDPR Cookie Consent plugin to store whether or not the user has consented to the use of cookies. It does not store any personal data. |
| Cookie | Duration | Description |
|---|---|---|
| A3 | 1 year | No description |
| AnalyticsSyncHistory | 1 month | No description |
| citrix_ns_id_.d2d.gsa.gov__wlf | session | No description |
| citrix_ns_id_.gsa.gov__wlf | session | No description |
| li_gc | 5 months 27 days | No description |
| ln_or | 1 day | No description |
| m | 2 years | No description available. |
| NSC_IUUQ-Ebub2Efd | session | No description |
| SSESSe6f64672c023222bafbc47f83a5ecbd4 | 23 days 4 hours | No description |
| TS01c2db25 | session | No description |
| Cookie | Duration | Description |
|---|---|---|
| _fbp | 3 months | This cookie is set by Facebook to display advertisements when either on Facebook or on a digital platform powered by Facebook advertising, after visiting the website. |
| c | 1 year | This cookie is set by Rubicon Project to control synchronization of user identification and exchange of user data between various ad services. |
| CONSENT | 2 years | YouTube sets this cookie via embedded youtube-videos and registers anonymous statistical data. |
| fr | 3 months | Facebook sets this cookie to show relevant advertisements to users by tracking user behaviour across the web, on sites that have Facebook pixel or Facebook social plugin. |
| IDE | 1 year 24 days | Google DoubleClick IDE cookies are used to store information about how the user uses the website to present them with relevant ads and according to the user profile. |
| test_cookie | 15 minutes | The test_cookie is set by doubleclick.net and is used to determine if the user's browser supports cookies. |
| tuuid | 1 year | The tuuid cookie, set by BidSwitch, stores an unique ID to determine what adverts the users have seen if they have visited any of the advertiser's websites. The information is used to decide when and how often users will see a certain banner. |
| tuuid_lu | 1 year | This cookie, set by BidSwitch, stores a unique ID to determine what adverts the users have seen while visiting an advertiser's website. This information is then used to understand when and how often users will see a certain banner. |
| VISITOR_INFO1_LIVE | 5 months 27 days | A cookie set by YouTube to measure bandwidth that determines whether the user gets the new or old player interface. |
| YSC | session | YSC cookie is set by Youtube and is used to track the views of embedded videos on Youtube pages. |
| yt-remote-connected-devices | never | YouTube sets this cookie to store the video preferences of the user using embedded YouTube video. |
| yt-remote-device-id | never | YouTube sets this cookie to store the video preferences of the user using embedded YouTube video. |
| yt.innertube::nextId | never | This cookie, set by YouTube, registers a unique ID to store data on what videos from YouTube the user has seen. |
| yt.innertube::requests | never | This cookie, set by YouTube, registers a unique ID to store data on what videos from YouTube the user has seen. |
| Cookie | Duration | Description |
|---|---|---|
| __hstc | 5 months 27 days | This is the main cookie set by Hubspot, for tracking visitors. It contains the domain, initial timestamp (first visit), last timestamp (last visit), current timestamp (this visit), and session number (increments for each subsequent session). |
| _ga | 2 years | The _ga cookie, installed by Google Analytics, calculates visitor, session and campaign data and also keeps track of site usage for the site's analytics report. The cookie stores information anonymously and assigns a randomly generated number to recognize unique visitors. |
| _ga_SQVZMMXYCW | 2 years | This cookie is installed by Google Analytics. |
| _gat_gtag_UA_88652169_15 | 1 minute | Set by Google to distinguish users. |
| _gat_UA-88652169-1 | 1 minute | A variation of the _gat cookie set by Google Analytics and Google Tag Manager to allow website owners to track visitor behaviour and measure site performance. The pattern element in the name contains the unique identity number of the account or website it relates to. |
| _gcl_au | 3 months | Provided by Google Tag Manager to experiment advertisement efficiency of websites using their services. |
| _gid | 1 day | Installed by Google Analytics, _gid cookie stores information on how visitors use a website, while also creating an analytics report of the website's performance. Some of the data that are collected include the number of visitors, their source, and the pages they visit anonymously. |
| hubspotutk | 5 months 27 days | HubSpot sets this cookie to keep track of the visitors to the website. This cookie is passed to HubSpot on form submission and used when deduplicating contacts. |
| Cookie | Duration | Description |
|---|---|---|
| __cf_bm | 30 minutes | This cookie, set by Cloudflare, is used to support Cloudflare Bot Management. |
| __hssc | 30 minutes | HubSpot sets this cookie to keep track of sessions and to determine if HubSpot should increment the session number and timestamps in the __hstc cookie. |
| bcookie | 1 year | LinkedIn sets this cookie from LinkedIn share buttons and ad tags to recognize browser ID. |
| bscookie | 1 year | LinkedIn sets this cookie to store performed actions on the website. |
| lang | session | LinkedIn sets this cookie to remember a user's language setting. |
| lidc | 1 day | LinkedIn sets the lidc cookie to facilitate data center selection. |
| messagesUtk | 5 months 27 days | HubSpot sets this cookie to recognize visitors who chat via the chatflows tool. |
| tads_uid | 5 years | The domain of this cookie is owned by Technorati.This cookie helps the user to share pages through social networking sites. The main purpose of this cookie is advertising. |
| UserMatchHistory | 1 month | LinkedIn sets this cookie for LinkedIn Ads ID syncing. |