
New York State Department of Transportation (NYSDOT) developed a pilot project in 2020 to test alternative transportation asset management data collection and analysis techniques.
The project covered 40 individual tenths-of-a-mile long highway segments in Albany County, and required data collection and analysis on the following inventory items in accordance with the Maintenance Quality Assurance (MQA) Handbook: road surface, roadside, drainage, vegetation, traffic, and additional assets.
JMT of New York (JMT) partnered with ARRB Systems (ARRB), and RoadBotics by Michelin to complete the pilot project. JMT, a multi-discipline engineering and architecture firm headquartered in Maryland, collected the data, rated the assets, and assembled the report. ARRB, a transportation infrastructure evaluation organization, completed data collection for the road surface analysis portion of the project. RoadBotics by Michelin provided the technology tools to complete the data collection and mapped visualization of road adjacent assets.
Monitoring and assessing road adjacent assets can be tedious, time-consuming, and dangerous. With a history of managing successful projects for over 50 years, JMT is constantly evolving their field data collection and assessment methods to not only keep up with current solution options, but also to confirm those solutions are efficient and cost-effective.
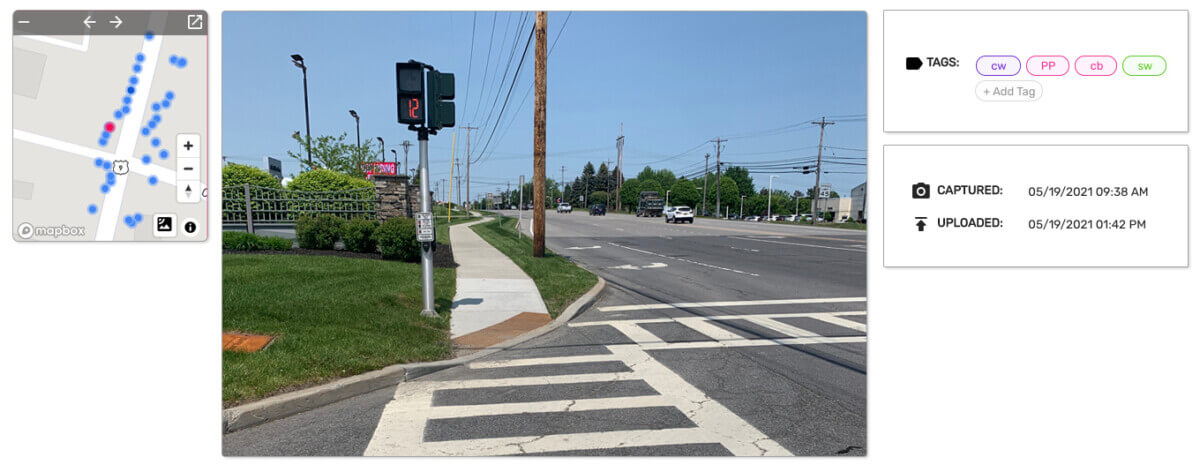
A screenshot from within JMT’s AgileMapper account showing custom tags.
For this project, JMT utilized RoadBotics by Michelin’s AgileMapper platform. AgileMapper is a powerful mapping tool for viewing, sorting, and analyzing visual data. Data collection can begin in the field using the AgileMapper smartphone application, or on the AgileMapper desktop website by uploading previously taken or other acquired visual data. For this project, photos were taken in real-time by JMT’s field crew and then uploaded to AgileMapper so engineers in the office could access the visual data instantly.
In the field, JMT’s engineers walked each segment on both sides of the road, taking photos of curb drop offs, storm drains, culverts, vegetation, traffic signals, crosswalks, and other roadside assets. A measuring tape and level were used to provide additional context in the images. Once the imagery was on AgileMapper, they were able to assess its condition and tag it appropriately.
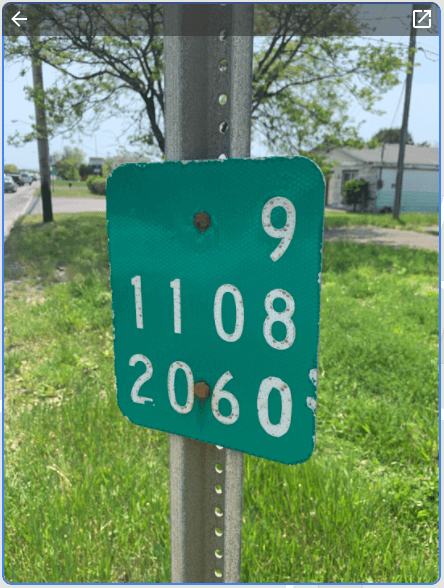
Each of the 40 road segments was made into an individual map on AgileMapper. To establish a searchable naming convention for such a large number of maps, JMT’s engineers photographed mile markers at the beginning and end of each 1/10th mile segment. AgileMapper’s artificial intelligence (AI) transcribed the text – for example, 9 1108 2060 – 9 1108 2061 – so engineers could search the map database they had created in AgileMapper by specific location. Every segment also contained geo-referenced images identified with additional tags applied by AI and by JMT engineers.
AgileMapper’s mapped visualization and custom tagging capabilities gave engineers the ability to easily view and organize close to 1,500 data points, plus have clear documentation of asset conditions.
During data collection and asset rating, JMT saved a total of 15-20 minutes per segment over the traditional field data collection and rating method. This represents a time saving of about 25%. The solution was not only efficient, but also promoted safety by minimizing the time the crew was exposed to highway traffic.
The ability to add photos to AgileMapper and archive the assets allows the data to be available for a number of uses, including for design projects, funding requests, and system performance evaluation.
In addition, the data will be used by NYSDOT to evaluate the efficacy of its highway maintenance effort and indicate where additional resources need be directed.
© 2023 RoadBotics, Inc | 322 North Shore Drive, Suite 200, Pittsburgh, PA 15212
| Cookie | Duration | Description |
|---|---|---|
| __hssrc | session | This cookie is set by Hubspot whenever it changes the session cookie. The __hssrc cookie set to 1 indicates that the user has restarted the browser, and if the cookie does not exist, it is assumed to be a new session. |
| _GRECAPTCHA | 5 months 27 days | This cookie is set by the Google recaptcha service to identify bots to protect the website against malicious spam attacks. |
| ak_bmsc | 2 hours | This cookie is used by Akamai to optimize site security by distinguishing between humans and bots |
| citrix_ns_id | session | This cookie is set by the provider Citrix, a web application firewall. This cookie is used for protecting the website against known and unknown attacks. |
| cookielawinfo-checkbox-advertisement | 1 year | Set by the GDPR Cookie Consent plugin, this cookie is used to record the user consent for the cookies in the "Advertisement" category . |
| cookielawinfo-checkbox-analytics | 1 year | Set by the GDPR Cookie Consent plugin, this cookie is used to record the user consent for the cookies in the "Analytics" category . |
| cookielawinfo-checkbox-functional | 1 year | The cookie is set by the GDPR Cookie Consent plugin to record the user consent for the cookies in the category "Functional". |
| cookielawinfo-checkbox-necessary | 1 year | Set by the GDPR Cookie Consent plugin, this cookie is used to record the user consent for the cookies in the "Necessary" category . |
| cookielawinfo-checkbox-others | 1 year | Set by the GDPR Cookie Consent plugin, this cookie is used to store the user consent for cookies in the category "Others". |
| cookielawinfo-checkbox-performance | 1 year | Set by the GDPR Cookie Consent plugin, this cookie is used to store the user consent for cookies in the category "Performance". |
| CookieLawInfoConsent | 1 year | Records the default button state of the corresponding category & the status of CCPA. It works only in coordination with the primary cookie. |
| elementor | never | This cookie is used by the website's WordPress theme. It allows the website owner to implement or change the website's content in real-time. |
| JSESSIONID | session | The JSESSIONID cookie is used by New Relic to store a session identifier so that New Relic can monitor session counts for an application. |
| viewed_cookie_policy | 1 year | The cookie is set by the GDPR Cookie Consent plugin to store whether or not the user has consented to the use of cookies. It does not store any personal data. |
| Cookie | Duration | Description |
|---|---|---|
| A3 | 1 year | No description |
| AnalyticsSyncHistory | 1 month | No description |
| citrix_ns_id_.d2d.gsa.gov__wlf | session | No description |
| citrix_ns_id_.gsa.gov__wlf | session | No description |
| li_gc | 5 months 27 days | No description |
| ln_or | 1 day | No description |
| m | 2 years | No description available. |
| NSC_IUUQ-Ebub2Efd | session | No description |
| SSESSe6f64672c023222bafbc47f83a5ecbd4 | 23 days 4 hours | No description |
| TS01c2db25 | session | No description |
| Cookie | Duration | Description |
|---|---|---|
| _fbp | 3 months | This cookie is set by Facebook to display advertisements when either on Facebook or on a digital platform powered by Facebook advertising, after visiting the website. |
| c | 1 year | This cookie is set by Rubicon Project to control synchronization of user identification and exchange of user data between various ad services. |
| CONSENT | 2 years | YouTube sets this cookie via embedded youtube-videos and registers anonymous statistical data. |
| fr | 3 months | Facebook sets this cookie to show relevant advertisements to users by tracking user behaviour across the web, on sites that have Facebook pixel or Facebook social plugin. |
| IDE | 1 year 24 days | Google DoubleClick IDE cookies are used to store information about how the user uses the website to present them with relevant ads and according to the user profile. |
| test_cookie | 15 minutes | The test_cookie is set by doubleclick.net and is used to determine if the user's browser supports cookies. |
| tuuid | 1 year | The tuuid cookie, set by BidSwitch, stores an unique ID to determine what adverts the users have seen if they have visited any of the advertiser's websites. The information is used to decide when and how often users will see a certain banner. |
| tuuid_lu | 1 year | This cookie, set by BidSwitch, stores a unique ID to determine what adverts the users have seen while visiting an advertiser's website. This information is then used to understand when and how often users will see a certain banner. |
| VISITOR_INFO1_LIVE | 5 months 27 days | A cookie set by YouTube to measure bandwidth that determines whether the user gets the new or old player interface. |
| YSC | session | YSC cookie is set by Youtube and is used to track the views of embedded videos on Youtube pages. |
| yt-remote-connected-devices | never | YouTube sets this cookie to store the video preferences of the user using embedded YouTube video. |
| yt-remote-device-id | never | YouTube sets this cookie to store the video preferences of the user using embedded YouTube video. |
| yt.innertube::nextId | never | This cookie, set by YouTube, registers a unique ID to store data on what videos from YouTube the user has seen. |
| yt.innertube::requests | never | This cookie, set by YouTube, registers a unique ID to store data on what videos from YouTube the user has seen. |
| Cookie | Duration | Description |
|---|---|---|
| __hstc | 5 months 27 days | This is the main cookie set by Hubspot, for tracking visitors. It contains the domain, initial timestamp (first visit), last timestamp (last visit), current timestamp (this visit), and session number (increments for each subsequent session). |
| _ga | 2 years | The _ga cookie, installed by Google Analytics, calculates visitor, session and campaign data and also keeps track of site usage for the site's analytics report. The cookie stores information anonymously and assigns a randomly generated number to recognize unique visitors. |
| _ga_SQVZMMXYCW | 2 years | This cookie is installed by Google Analytics. |
| _gat_gtag_UA_88652169_15 | 1 minute | Set by Google to distinguish users. |
| _gat_UA-88652169-1 | 1 minute | A variation of the _gat cookie set by Google Analytics and Google Tag Manager to allow website owners to track visitor behaviour and measure site performance. The pattern element in the name contains the unique identity number of the account or website it relates to. |
| _gcl_au | 3 months | Provided by Google Tag Manager to experiment advertisement efficiency of websites using their services. |
| _gid | 1 day | Installed by Google Analytics, _gid cookie stores information on how visitors use a website, while also creating an analytics report of the website's performance. Some of the data that are collected include the number of visitors, their source, and the pages they visit anonymously. |
| hubspotutk | 5 months 27 days | HubSpot sets this cookie to keep track of the visitors to the website. This cookie is passed to HubSpot on form submission and used when deduplicating contacts. |
| Cookie | Duration | Description |
|---|---|---|
| __cf_bm | 30 minutes | This cookie, set by Cloudflare, is used to support Cloudflare Bot Management. |
| __hssc | 30 minutes | HubSpot sets this cookie to keep track of sessions and to determine if HubSpot should increment the session number and timestamps in the __hstc cookie. |
| bcookie | 1 year | LinkedIn sets this cookie from LinkedIn share buttons and ad tags to recognize browser ID. |
| bscookie | 1 year | LinkedIn sets this cookie to store performed actions on the website. |
| lang | session | LinkedIn sets this cookie to remember a user's language setting. |
| lidc | 1 day | LinkedIn sets the lidc cookie to facilitate data center selection. |
| messagesUtk | 5 months 27 days | HubSpot sets this cookie to recognize visitors who chat via the chatflows tool. |
| tads_uid | 5 years | The domain of this cookie is owned by Technorati.This cookie helps the user to share pages through social networking sites. The main purpose of this cookie is advertising. |
| UserMatchHistory | 1 month | LinkedIn sets this cookie for LinkedIn Ads ID syncing. |