


Can you believe this is the 10th anniversary of Infrastructure Week?
The historical passing of the Infrastructure Bill and the initial distribution of funds has set a new tone for rebuilding our country’s roads, bridges, and other vital assets.
At RoadBotics, we believe building better infrastructure starts with having objective, actionable data, and you can’t get to where you want to go without knowing your starting point.
To showcase how AI-powered mapping technology is supporting communities, we’ve rounded up 10 places across the country making data-driven decisions about their road networks and infrastructure assets thanks to RoadBotics!
“It’s a challenge to send one person out regularly to use their best judgment and determine the rating of the road conditions,” said Jason Dailey, Public Works Director of Cranberry Township. “You’re always allowing human error to influence the ratings.” – Jason Dailey, Former Public Works Director of Cranberry Township
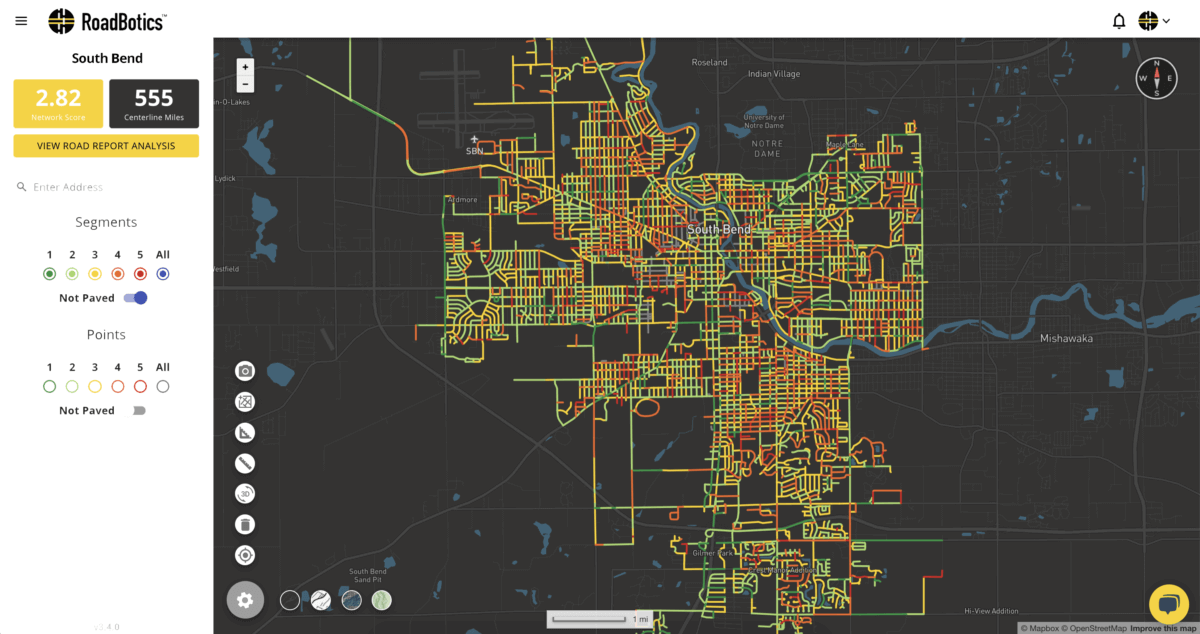
“Our team spent a lot of time researching companies that could perform roadway evaluations. RoadBotics had everything we were looking for. Between the quick evaluation process, easy integration with our GIS data and excellent customer support, RoadBotics excelled at it all.” – Scott Kreeger, Project Engineer – City of South Bend, IN
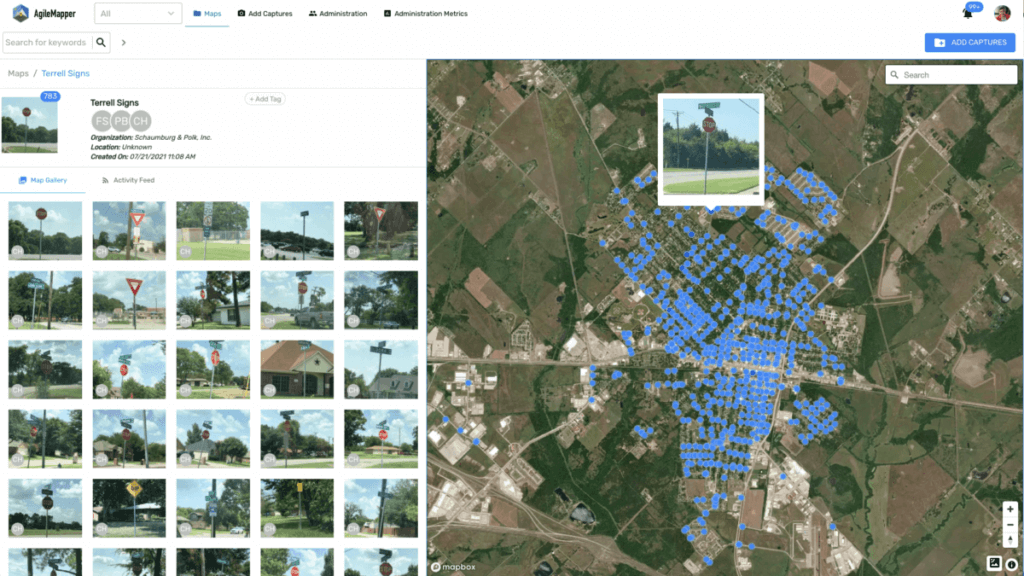
The City of Terrell was looking for a streamlined way to objectively record the assets’ location and condition so they could confidently allocate funds and plan for the future.
Using AgileMapper, SPI found that the City of Terrell’s traffic signs were in fair to poor condition. It is estimated that approximately 40% of signs would require replacement or remounting to bring the overall score to a good to excellent rating.
“This partnership with RoadBotics will allow us to better assess the overall condition of City roadways and increase the accuracy of the data collected. It ultimately allows us to be more effective in managing the replacement of our infrastructure. Our goal is to use our resources in the most efficient manner possible. RoadBotics helps us accomplish that goal by enhancing our ability to better plan and implement City-wide roadway replacement schedules”. – Heath Lloyd, Chief Infrastructure and Development Officer
“We’re very satisfied with the assessments and would 100% recommend RoadBotics to every municipality to help them with their road maintenance.” – Lou Lambros, Bethel Park Municipal Engineer
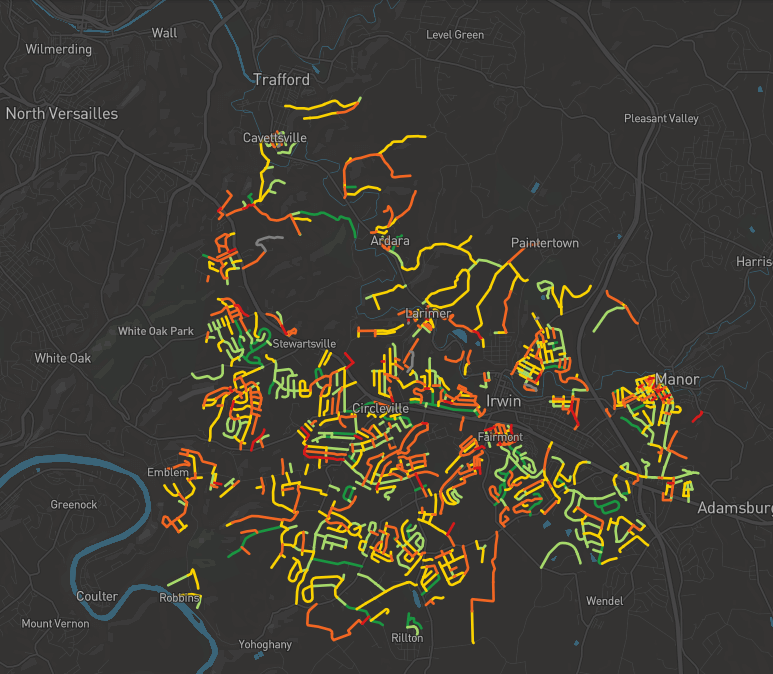
Peters Township was able to objectively determine and confirm the worst 25 miles of roads using RoadBotics 1 – 5 rating system, where 1 is dark green, representing the best roads, and 5 is red, noting the worst… The assessment provided objective feedback on their decisions, and the online platform allowed them to perform some aspects of their planning remotely.
New York State Department of Transportation (NYSDOT) developed a pilot project in 2020 to test alternative transportation asset management data collection and analysis Techniques.
For this project, JMT utilized RoadBotics’ AgileMapper platform. AgileMapper’s mapped visualization and custom tagging capabilities gave engineers the ability to easily view and organize close to 1,500 data points, plus have clear documentation of asset conditions.
“We want to make sure we’re looking at our paving program in a township perspective and not just by wards. With RoadBotics data, we can justify our paving program to our wards.” -Michael Turley Associate Township Manager, North Huntington Township
“RoadBotics has provided Dublin with simplistic, easily digestible pavement data..”- Robert J. Taylor, PE Director of Asset Management & Support Services
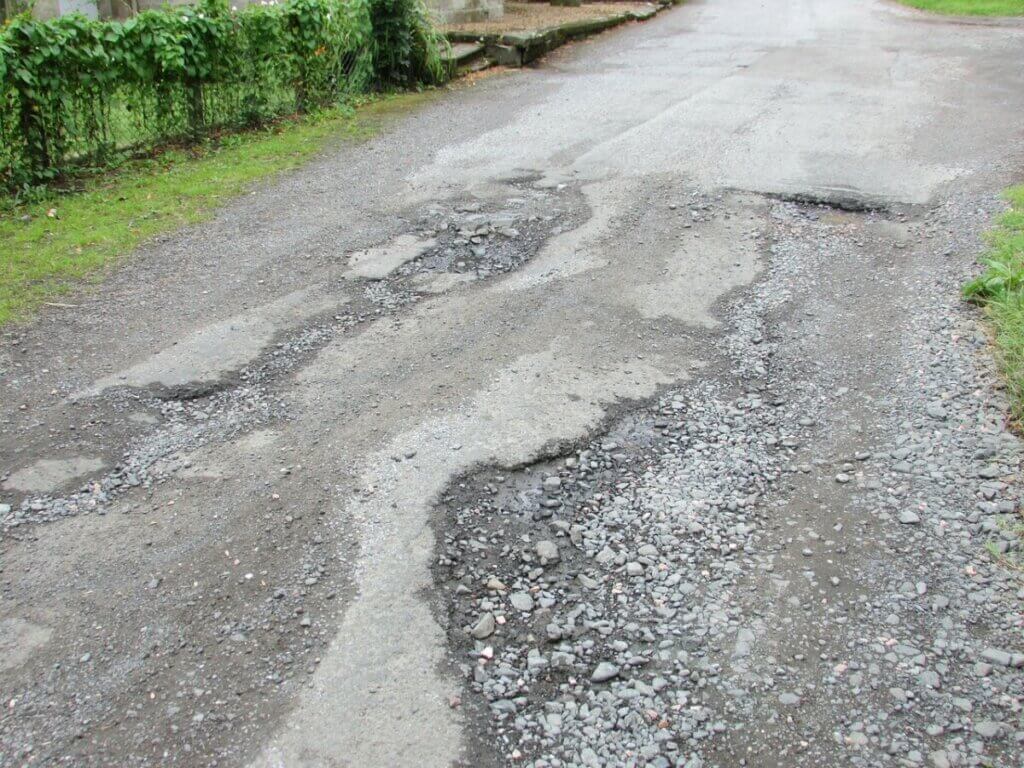
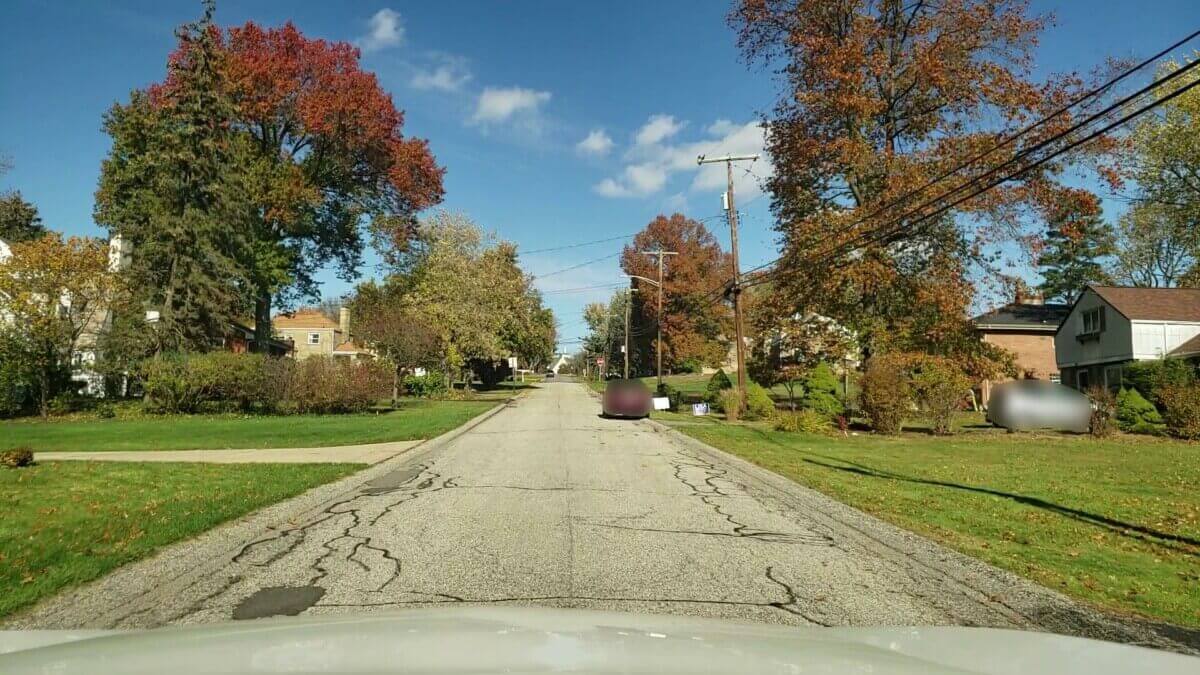
Prior to RoadBotics, public works crews would assess the condition of their 260-mile road network manually by closing down sections of it and performing a visual inspection.
The City of Clovis chose RoadBotics because of the simplicity of the 1-5 rating system, where 1 equates to ‘no or minor surface distress’ and 5 is ‘major surface damage and/or critical fatigue issues’.’ They also liked that the data could be easily interpreted and the color-coded assessment map could be shared with residents.
We hope you enjoyed our round up of 10 data-driven decisions! Continue learning how AI-powered mapping technology can support your community at our Infrastructure Week Web Event!
Sign up for the event happening Wednesday, May 18 at 2 PM EST!

© 2023 RoadBotics, Inc | 322 North Shore Drive, Suite 200, Pittsburgh, PA 15212
| Cookie | Duration | Description |
|---|---|---|
| __hssrc | session | This cookie is set by Hubspot whenever it changes the session cookie. The __hssrc cookie set to 1 indicates that the user has restarted the browser, and if the cookie does not exist, it is assumed to be a new session. |
| _GRECAPTCHA | 5 months 27 days | This cookie is set by the Google recaptcha service to identify bots to protect the website against malicious spam attacks. |
| ak_bmsc | 2 hours | This cookie is used by Akamai to optimize site security by distinguishing between humans and bots |
| citrix_ns_id | session | This cookie is set by the provider Citrix, a web application firewall. This cookie is used for protecting the website against known and unknown attacks. |
| cookielawinfo-checkbox-advertisement | 1 year | Set by the GDPR Cookie Consent plugin, this cookie is used to record the user consent for the cookies in the "Advertisement" category . |
| cookielawinfo-checkbox-analytics | 1 year | Set by the GDPR Cookie Consent plugin, this cookie is used to record the user consent for the cookies in the "Analytics" category . |
| cookielawinfo-checkbox-functional | 1 year | The cookie is set by the GDPR Cookie Consent plugin to record the user consent for the cookies in the category "Functional". |
| cookielawinfo-checkbox-necessary | 1 year | Set by the GDPR Cookie Consent plugin, this cookie is used to record the user consent for the cookies in the "Necessary" category . |
| cookielawinfo-checkbox-others | 1 year | Set by the GDPR Cookie Consent plugin, this cookie is used to store the user consent for cookies in the category "Others". |
| cookielawinfo-checkbox-performance | 1 year | Set by the GDPR Cookie Consent plugin, this cookie is used to store the user consent for cookies in the category "Performance". |
| CookieLawInfoConsent | 1 year | Records the default button state of the corresponding category & the status of CCPA. It works only in coordination with the primary cookie. |
| elementor | never | This cookie is used by the website's WordPress theme. It allows the website owner to implement or change the website's content in real-time. |
| JSESSIONID | session | The JSESSIONID cookie is used by New Relic to store a session identifier so that New Relic can monitor session counts for an application. |
| viewed_cookie_policy | 1 year | The cookie is set by the GDPR Cookie Consent plugin to store whether or not the user has consented to the use of cookies. It does not store any personal data. |
| Cookie | Duration | Description |
|---|---|---|
| A3 | 1 year | No description |
| AnalyticsSyncHistory | 1 month | No description |
| citrix_ns_id_.d2d.gsa.gov__wlf | session | No description |
| citrix_ns_id_.gsa.gov__wlf | session | No description |
| li_gc | 5 months 27 days | No description |
| ln_or | 1 day | No description |
| m | 2 years | No description available. |
| NSC_IUUQ-Ebub2Efd | session | No description |
| SSESSe6f64672c023222bafbc47f83a5ecbd4 | 23 days 4 hours | No description |
| TS01c2db25 | session | No description |
| Cookie | Duration | Description |
|---|---|---|
| _fbp | 3 months | This cookie is set by Facebook to display advertisements when either on Facebook or on a digital platform powered by Facebook advertising, after visiting the website. |
| c | 1 year | This cookie is set by Rubicon Project to control synchronization of user identification and exchange of user data between various ad services. |
| CONSENT | 2 years | YouTube sets this cookie via embedded youtube-videos and registers anonymous statistical data. |
| fr | 3 months | Facebook sets this cookie to show relevant advertisements to users by tracking user behaviour across the web, on sites that have Facebook pixel or Facebook social plugin. |
| IDE | 1 year 24 days | Google DoubleClick IDE cookies are used to store information about how the user uses the website to present them with relevant ads and according to the user profile. |
| test_cookie | 15 minutes | The test_cookie is set by doubleclick.net and is used to determine if the user's browser supports cookies. |
| tuuid | 1 year | The tuuid cookie, set by BidSwitch, stores an unique ID to determine what adverts the users have seen if they have visited any of the advertiser's websites. The information is used to decide when and how often users will see a certain banner. |
| tuuid_lu | 1 year | This cookie, set by BidSwitch, stores a unique ID to determine what adverts the users have seen while visiting an advertiser's website. This information is then used to understand when and how often users will see a certain banner. |
| VISITOR_INFO1_LIVE | 5 months 27 days | A cookie set by YouTube to measure bandwidth that determines whether the user gets the new or old player interface. |
| YSC | session | YSC cookie is set by Youtube and is used to track the views of embedded videos on Youtube pages. |
| yt-remote-connected-devices | never | YouTube sets this cookie to store the video preferences of the user using embedded YouTube video. |
| yt-remote-device-id | never | YouTube sets this cookie to store the video preferences of the user using embedded YouTube video. |
| yt.innertube::nextId | never | This cookie, set by YouTube, registers a unique ID to store data on what videos from YouTube the user has seen. |
| yt.innertube::requests | never | This cookie, set by YouTube, registers a unique ID to store data on what videos from YouTube the user has seen. |
| Cookie | Duration | Description |
|---|---|---|
| __hstc | 5 months 27 days | This is the main cookie set by Hubspot, for tracking visitors. It contains the domain, initial timestamp (first visit), last timestamp (last visit), current timestamp (this visit), and session number (increments for each subsequent session). |
| _ga | 2 years | The _ga cookie, installed by Google Analytics, calculates visitor, session and campaign data and also keeps track of site usage for the site's analytics report. The cookie stores information anonymously and assigns a randomly generated number to recognize unique visitors. |
| _ga_SQVZMMXYCW | 2 years | This cookie is installed by Google Analytics. |
| _gat_gtag_UA_88652169_15 | 1 minute | Set by Google to distinguish users. |
| _gat_UA-88652169-1 | 1 minute | A variation of the _gat cookie set by Google Analytics and Google Tag Manager to allow website owners to track visitor behaviour and measure site performance. The pattern element in the name contains the unique identity number of the account or website it relates to. |
| _gcl_au | 3 months | Provided by Google Tag Manager to experiment advertisement efficiency of websites using their services. |
| _gid | 1 day | Installed by Google Analytics, _gid cookie stores information on how visitors use a website, while also creating an analytics report of the website's performance. Some of the data that are collected include the number of visitors, their source, and the pages they visit anonymously. |
| hubspotutk | 5 months 27 days | HubSpot sets this cookie to keep track of the visitors to the website. This cookie is passed to HubSpot on form submission and used when deduplicating contacts. |
| Cookie | Duration | Description |
|---|---|---|
| __cf_bm | 30 minutes | This cookie, set by Cloudflare, is used to support Cloudflare Bot Management. |
| __hssc | 30 minutes | HubSpot sets this cookie to keep track of sessions and to determine if HubSpot should increment the session number and timestamps in the __hstc cookie. |
| bcookie | 1 year | LinkedIn sets this cookie from LinkedIn share buttons and ad tags to recognize browser ID. |
| bscookie | 1 year | LinkedIn sets this cookie to store performed actions on the website. |
| lang | session | LinkedIn sets this cookie to remember a user's language setting. |
| lidc | 1 day | LinkedIn sets the lidc cookie to facilitate data center selection. |
| messagesUtk | 5 months 27 days | HubSpot sets this cookie to recognize visitors who chat via the chatflows tool. |
| tads_uid | 5 years | The domain of this cookie is owned by Technorati.This cookie helps the user to share pages through social networking sites. The main purpose of this cookie is advertising. |
| UserMatchHistory | 1 month | LinkedIn sets this cookie for LinkedIn Ads ID syncing. |